Digital Tools Called In To Communicate Sensitive Bypass Plans
 |
| TOUGH SITE Lasers mapped foundations but cores still had to be bored. |
As final design work nears completion and construction of approach roads begins, planners are saluting the contributions of laser mapping and three-dimensional modeling. The technologies helped them steer a $231-million, 3.5-mile road and bridge bypass project at Hoover Dam through a thicket of engineering issues and an approval process involving two states, six government agencies and a highly energized public sector.
"The ability to not only solve it technically, but present your solution and convey it to the public are just abject requirements when you’ve got a job like this," says S. Dave Zanetell, project manager for the Federal Highway Administration’s Central Federal Lands Hoover Dam Bypass project. He says visualization tools have been crucial aides in bringing forth the project. "You can’t measure the value of the ability to show people exactly what things are going to look like," he says.
| VIDEO |
| Animated rendering of bypass construction at Hoover Dam shows cut and fill and flying leap above the abyss. |
| To be viewed with Quick Time |
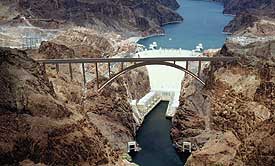
The bypass, which is expected to open in October 2004 pending continued funding, will relieve congestion on U.S. Route 93, which runs across the dam’s crest. The bypass is 1,500 ft downstream of the dam. New construction is in three phases. It includes a $21.5-million, 1.8-mile, four-lane asphalt approach on the Arizona side of the Colorado River, now about 50% complete; a 1,900-ft-long steel and concrete arch span across the river; and a 2.5-mile, four-lane approach on the Nevada side.
The design team, designated the Hoover Support Team, is a consortium headed up by HDR Engineering Inc., Omaha. Major partners are the Sverdrup Civil, an arm of Jacobs Engineering, Pasadena, Calif., and bridge designers T.Y. Lin International, San Francisco.
The main bridge will leap Black Canyon almost 900 ft above the river. Siting its foundations on the nearly vertical canyon walls 100 to 140 ft below the top called for site inspection by laser scanning. Data was first used to study foundations, but has since been incorporated into a digital terrain map of the entire project area.
Site analysis was tasked to AMEC Earth and Environmental Inc., Philadelphia. It began in October 2001 by mapping canyon walls from the opposite sides with long-range laser scanners, says David Peterson, AMEC project manager. A 1-ft contour, digital terrain map was created of a 2,200-ft-long, 300-ft-wide belt. Investigators used it, as well as the raw photo-like point cloud data produced by the scanners, to search for "fatal flaws," such as faults, Peterson says. It also flagged areas for physical inspection, most of which was accomplished by rappelling down the face of the cliff (ENR 6/24/02 p. 15).
"We have challenging conditions at the gorge logistically, but the foundations themselves will be sitting on good solid rock," says David Goodyear, project chief bridge engineer for T.Y. Lin. "We’re just constrained by finding level benches in the topography."
Without the ability to integrate topographic and geometric items, "twenty years ago you’d likely have done a lot of it on the fly," says Goodyear. "Now, we’re able to get the baseline data earlier and have it be more reliable during design."
The digital map of the canyon, as well as maps of the approach roadway sites, were then used by VanDevanter Associates, Vashon Island, Wash., to create a 3D model of the surrounding landscape upon which renderings of various alternatives, including 6 candidates for the main bridge design, could be imposed. Mark VanDevanter, principal, then used aerial photography to drape the topographic data with the image of the landscape. He then used the InRoads and GeoPak CAD plans of the roadway, including cut and fill edge lines, to create an animated fly-through in a proprietary program called VANPLAY. The program is designed for presentations and allows the flying action to be stopped, reversed or copied by frames to facilitate public discussions.
 |
 |
| VISUAL Digital terrain maps formed base for fly throughs and 3D imagery. |
The bridge will soar 230 ft above the dam’s crest, and the ability to help both professionals and laypersons quickly grasp the appearance of alternatives was critical to staying on planning schedule. Ultimately, eight alternatives were presented. The steel and concrete single-span alternative was selected after passing muster with an advisory panel of architects and a structural management group comprised of engineers with FHWA and Arizona and Nevada state engineers.
In addition to helping the public grasp the project, the laser mapping and detailed site investigation also helped determine the project would cost $33 million more than originally estimated. Up to 80 rock bolts may be needed to stabilize vertical angles of the rock walls. and controlled explosives will be needed on 100-ft-deep cuts. "Every bit of material has to be blasted–there’s no dirt to be moved," says Zanetell. On the other hand, the rock eliminates some high-risk uncertainties, he says. "We don’t have clay seams or water pockets," he says.
Planners also realized that drivers using the bypass are certain to crane their necks to view the dam. They were able to site an observation platform and access trail using 3D modeling and simulation. "It was really hard to tell [at] what elevation to locate it, how to put a trail around steep terrain and to get a feel for what the view will be like," says VanDevanter.
Bids for the project’s 1,090-ft-long main arch, expected to cost some $80 million, will be advertised in October, pending federal funding approval. Bids for the Nevada approach are to be opened Aug. 12.
(Photos, Image and Video courtesy of CFLHD/Hoover Support Team)
|