Where are We Going in Construction? Do the Math
Construction and technology can be strange bedfellows at times.
Take the U.S. Air Force example: Last year it graduated fewer fighter pilots and now uses more virtual pilots than real aviators (with UAV—unmanned aerial vehicles such as Predator drones). That's one story of innovation and its impact.
What does this mean for the construction industry? How is innovation affecting our profession? Sometimes you have to review the basics to understand the trends.
In “Diffusion of Innovation,” by Everett Rogers, a sociologist from the University of Iowa, Rogers uses math and charts based on his theory of how ideas, trends, and technologies catch fire and spread, to help explain the stages of innovation adoption. He uses classifications ranging from "early adopter," through "early majority," then "late majority" to "laggard" and a time line to explore trends in the adoption of innovative construction technology, such as building information modeling, and projections of trend acceleration in the future.
When those trends gets tracked against the shifting bulge of users climbing on board, the implications for market share and competitive opportunity become hard to ignore.
You may suspect you know where you and your company fall on the adoption scale, but you may not fully appreciate the business consequences of your style without throwing in a little more analysis.
So, let's look at the math.
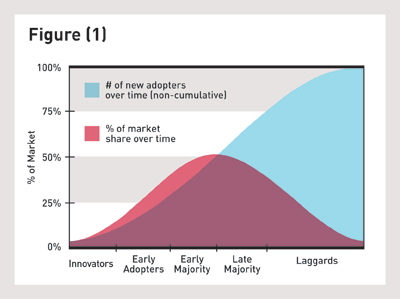
Figure 1 (top left) is from “Diffusion of Innovation,” by Everett Rogers, a sociologist from the University of Iowa, based on his theory of how ideas, trends, and technologies catch fire and spread. It is summarized by a bell and an S-curve. For you “Matheletes” out there, it is a normal or Gaussian distribution. For the rest of us it is a Chart of Diffusion. (And we know it's factual because it's done by a guy who used the “scientific” function on his calculator.)
The time line (x-axis) passes through the stages of adoption, to which we are intuitively familiar. If you've waited in line to purchase the first generation of iPads, you are an early adopter. On the other end, if you still have a hand-written address book, you're looking like a laggard. At the start of “Early Majority” you may have adopted innovative technology but on average about two other colleagues (or competitors) may not. By the end of “Late Majority” it reverses; you are either in or outnumbered by a margin of two to one.
The blue line S-curve represents percentage of market share, and gradually increases along the y-axis until it races up from the growing majority of innovation users. Construction technology, such as BIM (Building Information Modeling) or other technology, will also fit this pattern. We liberally interpret the “market share” for the market that expects and will employ that technology. It is a small percentage at present—looking across the entire construction team—but it will inevitably increase, and fast. This trend applies to you, your colleagues and your competition and will alter how you design and build and operate.
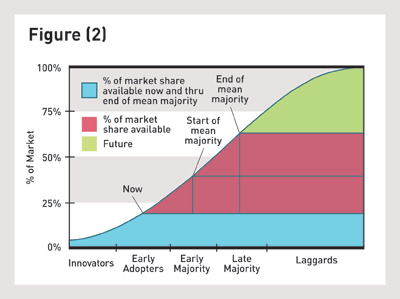
Currently, construction technologies are somewhere in the Early Adopters stage (see Figure 2). To see where we're going in the not too distant future I've added the time frame “Mean Majority.” It starts when about 4 in 10 of our colleagues/competitors are on board and runs through to about 6 in every 10. This illustrates a realistic gauge of where we stand, adopting on average either a bit early or a bit late. It's not too difficult to imagine where we fit or see ourselves fitting. It also encompasses an area of the greatest slope (∆y/∆x), the greatest increase of market share over a period of time. This is impressive.
Assuming you haven't started yet, at Now, the market for your services will roughly double by the start of Mean Majority. Even better, if starting Now – and counting the time in getting all the rest of Mean Majority on board -- the market share really takes off. (The converse is also true: don't and it won't.)
The variable, of course, is time. The x-axis will shrink or stretch with either a quickening or slower economy. We don't know how long it will take, we just know it will get there. Remember the ads, You can't win if you don't play? We can now say, If you don't play, you will lose. Lose market share to someone else. Figure after Mean Majority about half of the Late Majority will have missed out. Count on Laggards losing business, clients, projects, and jobs. But hey, they will still have their old address books, right?
Fortunately, most of us imagine ourselves somewhere on the curve and on our way up. We can't control the time line, but we see how the numbers add up. We most definitely “get it" — because we just did the math.
Michael Avramides, AIA, is an award-winning architect of distinctive buildings including high-rise. He is also a BIM consultant for owners, builders and designers. You can write him directly at: MCA@avramides.com.


