Washington was a key driver of second-quarter energy costs, with political actions and regulatory intervention affecting power sources from oil and coal to solar and wind.
In May, U.S. crude reached $70 per barrel—for the first time since November 2014. Among key contributing factors to the rise were fears of constrained Iran supply following President Donald Trump’s withdrawal from the Iranian nuclear weapons pact, and election uncertainties in Iraq, Lebanon and Venezuela. But higher prices also have the countervailing effect of boosting production. The U.S. Energy Information Administration (EIA) projects U.S. crude-oil producers will generate 10.7 million barrels per day in 2018 on average, up from 9.4 million bpd in 2017. Production will average 11.9 million bpd in 2019.
There is also a follow-on effect in natural gas supply. EIA forecasts dry natural-gas production averaging 80.5 billion cu ft per day in 2018, a new record. Much of it is from unconventional U.S. shale oil fields. Natural gas became the top power plant fuel for the first time in 2015, and EIA sees utility-scale gas-fired generation up to 34% in 2018 and 2019 from 32% in 2017, with coal slipping to 28% in this same period, down from 30% in 2017.
Propped-Up Nukes?
The nuclear power market also has felt the effects of cheap gas, which often sets prices in wholesale power markets. Nuclear made up 20% of U.S. power in 2017; EIA predicts a slip to 19% by 2019. “For the past few years, new U.S. generation has been half wind and solar, and half gas,” says Joshua Rhodes, a University of Texas energy researcher. “Not a single coal plant is being built except for a test facility in Alaska. It’s a function of low gas prices.”
That trend does not sit well with President Trump, who campaigned on putting coal miners back to work. Last September, Energy Secretary Rick Perry directed the Federal Energy Regulatory Commission to find a way to pay for the reliability that coal and nuclear power provide. FERC rejected that directive in January, instead telling wholesale power-market operators to assess how to enhance system resilience.
In June, Trump ordered Perry to halt coal and nuclear plant closures, citing national security concerns, a move several energy experts have refuted. Trump also moved on campaign promises with new tariffs on some imported solar cells and, separately, on imported steel and aluminum (see story, p. 16). But steel tariffs could slow U.S. energy growth. The Independent Petroleum Association of America told the White House that tariffs could imperil pipeline build-out to move fuels to market.
Solar-cell tariffs could add up to $1 per MWh to current projects, says Rhodes, and “are troubling,” adds a Solar Energy Industries Association (SEIA) spokesman. It is hard to gauge the effect because the solar power federal investment tax credit is being phased out, the spokesman says, but the tariffs do not change fundamentals. Solar panel prices have dropped 60% since 2013. “That is mostly market driven,” he says. SEIA predicts 100 GW of solar power installed by the end of 2022, up from 53 GW in 2017.
Going With the Wind
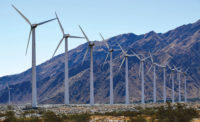
Falling wind power costs also have enabled strong demand from utilities, and from corporate and industrial purchasers, says John Hensley, a senior director at the American Wind Energy Association. The 2018 first quarter was the most active for wind-power purchase deals since the group’s deal analysis began in 2013, he says. There are 34 GW of wind projects being built or developed as of April, up 40% from the same time in 2017.
More utilities also are locking in low prices with 10- or 15-year purchase deals. Rhodes says. “You can’t do that with gas,” which has much more price volatility, he adds. There also is a U.S. trend away from large gigawatt-scale power plants. “A $10-million mistake is better than a $100-million mistake,” says Rhodes.


Post a comment to this article
Report Abusive Comment