Transportation Infrastructure
States Pare Deficient-Bridge Total, but 55,000 Still on List
Did states upgrade enough bridges in 2016 to dent the backlog?
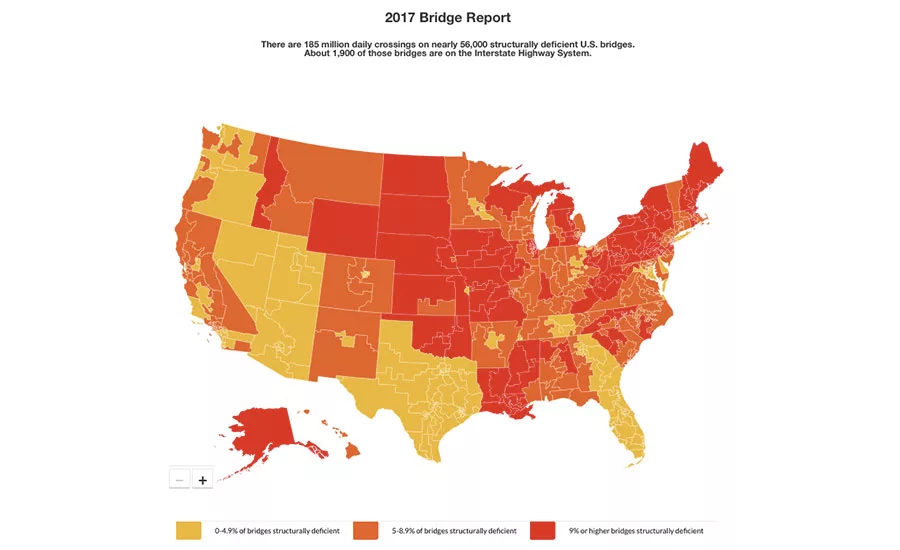
Percentages of deficient bridges vary from state to state.
Map courtesy of ARTBA
The number of structurally deficient U.S. bridges dipped slightly last year, but the total still stands at a daunting 55,170, according to a new American Road & Transportation Builders Association analysis of federal data.
The ARTBA report, released on Feb. 15, shows that states were able to reduce their total number of deficient bridges by 2,785 last year, or about 5%.
The study is based on the Federal Highway Administration’s 2016 National Bridge Inventory files, released in January. The data cover a total of 612,079 bridges in the 50 states and the District of Columbia.
Alison Premo Black, ARTBA chief economist, noted that, if last year’s 5% improvement continues, it would take more than 20 years to replace or fix all the deficient bridges. It may take longer than that if new bridges are added to the list over that period of time, which is almost certain to happen.
Black, who carried out the analysis, added in a statement, “State transportation departments haven’t been provided the resources to keep pace with the nation’s bridge needs.”
A structurally deficient rating doesn't imply that a bridge is unsafe, the Federal Highway Administration noted. FHWA requires state agencies to inspect their bridges regularly. For safety reasons, states post vehicle-weight limits for some deficient bridges and, in the most serious cases, shut them down.
The report’s release comes as construction, transportation and state highway agencies are anxiously awaiting President Trump’s promised $1-trillion, 10-year infrastructure investment program. There are no signs that the plan’s release is imminent.
Looking for quick answers on construction and engineering topics?
Try Ask ENR, our new smart AI search tool.
Ask ENR →
Transportation and construction organizations also have been concerned that the U.S. Dept. of Transportation, like other federal agencies, is operating under a stopgap spending bill that doesn’t include the highway funding increase for fiscal year 2017 authorized by the Fixing America’s Surface Transporation Act. That funding shortfall, some of which would presumably go for bridge repairs, amounts to about $900 million.
Iowa has the largest number of structurally deficient bridges, with 4,968, according to ARTBA’s state-by-state tabulation. Pennsylvania ranks second, with 4,506, followed by Oklahoma, 3,460; Missouri, 3,195; and Nebraska, 2,361.
Rhode Island ranks worst among states by another measurement, with 24.9% of its total spans categorized as deficient. Iowa is second, at 20.5%. Ranking third is Pennsylvania, with 19.8%, followed by South Dakota, at 19.6%, and West Virginia, at 17.3%.
Washington, D.C., has the fewest deficient bridges, with nine. Nevada is next, with 31.
The vast majority of states reduced their backlogs of structurally deficient bridges, with 39 posting decreases over the 2015 totals, led by California, which cut its total by a strong 30.9%.
Ten states recorded year-to-year increases in deficient spans. West Virginia had the largest upturn, with 14.2%. Two states, Illinois and Utah, were flat.
Looking at a longer time span, the most recent U.S. DOT report on highway and transit conditions and performance shows that the number of structurally deficient bridges dropped 20.6%, to 66,749 in 2012, from 84,031 in 2002.
That report, which the U.S. DOT released on Jan. 12, includes only data through 2012, however. It excludes the impact of two major transportation bills, 2012’s Moving Ahead for Progress in the 21st Century Act and 2015’s FAST Act.
The American Association of State Highway and Transportation Officials declined to comment on the ARTBA report.
Story corrected on Feb. 22 and Feb.28 to state that the number of structurally deficient bridges was reduced by about 5% in 2016, not 0.5%.


