Summary
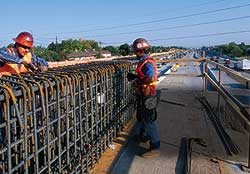 |
| (Photo by Michael Goodman for ENR) |
At the end of this quarter, the Federal Reserve Board announced that it was going to stand pat on its policy of keeping the economy afloat through cheap money. Believing inflation is firmly under control, the Fed kept its funds rate at 1%, the lowest level since the 1950s, and it strongly hinted that it would keep rates low for a while.
While overall inflation in the construction industry remains between 2 to 4%, extremely low interest rates have led to some pockets of extreme inflation this quarter. The housing market that had been speeding along for several years suddenly went into overdrive this summer as home owners sensed that mortgage rates had probably bottomed out and could start climbing soon. The resulting rush to build pushed up prices for structural panels, lumber, wallboard and other materials. Up until that point, these industries had a difficult time making price increases stick despite record levels of demand. ![]() Click here to view chart
Click here to view chart
"In the past 50 years, there has only been one other three-month period when actual single-family housing starts were as high as they were this summer and back then usage was much lower," says Paul Jannke, vice president of wood products for Resource Information Systems Inc., a Bedford, Mass.-based forecasting firm. That required an extra 260 million sq ft of panel above the previous peak demand, he says.
Prices for 1/2 -in. plywood rose from $256 per msf at the beginning of June to $535 by mid-September, Jannke says. Prices for oriented strand board posted similar increases, rising from $237 per msf to $445 during the same period.
|
It was widely reported in the general press that a military order for 20 million sq ft of plywood to support troops in Iraq and restock supplies contributed to the spike in prices, but Jannke disputes that theory. Even in a tight market, the military purchase was not large enough to move prices on a national level, he says. "If military spending had such an impact on plywood prices, then how do you explain equally large price increases for OSB, which the military did not buy?" Jannke asks.
Lumber and wallboard prices also were affected by the hot housing market. The mill price for lumber jumped 11% in August, according to the composite price index of Random Lengths, Eugene, Ore. In the third quarter, ENR’s 20-city average wholesale price for 2x4s increased 6%, breaking a year-long series of declines. During the same period, ENR’s price for 1�2-in. wallboard rose 8%. ![]() Click here to view chart
Click here to view chart
Despite rising unemployment and a slowdown in the private nonresidential building market, both union and nonunion wage settlements are matching last year’s increases. But given those market conditions, this year’s average first-year 4.1% increase in wage and fringes for union workers and a 3.9% annual increase in nonunion workers’ base wage are raising some eyebrows.
"Productivity is not increasing at the rate that wages are," says Rod Johannsen, managing director of TDIndustries Ltd., Dallas. "Anytime you get out of sync like that at some point [the labor market] has to recalibrate itself," he says.
Labor costs could receive another blow if the mounting pressure on insurance companies to raise workers’ compensation rates does not abate.
Two of the most expensive states for workers’ compensation insurance in construction are taking steps to curtail costs. Florida’s costs for permanent partial disability claims run twice the national average and Gov. Jeb Bush (R) signed legislation in July aimed at saving $400 million, or 12.5% of the system’s annual cost.
California’s overall worker’s comp costs have ballooned from $9 billion in 1995 to $29 billion this year. It has proposed legislation to cut annual costs by $6 billion. California’s reforms require the establishment of a fee schedule for outpatient care, caps the number of physical therapy and chiropractic treatments and triples the maximum fine for fraud.
| Construction Materials Price Movement in 2003 | ||||||||
| Jan. | Feb. | March | April | May | June | July | ||
| Aggregates | Monthly % chg. | +0.5 | +0.5 | +0.1 | +0.4 | +0.2 | +0.4 | –0.2 |
| Annual % chg. | +2.2 | +2.2 | +2.0 | +2.1 | +2.1 | +2.5 | +2.1 | |
| Aluminum Sheet | Monthly % chg. | +0.1 | 0.0 | 0.0 | 0.0 | NA | NA | –2.3 |
| Annual % chg. | –2.0 | –2.0 | –2.2 | +1.3 | NA | +3.8 | +1.3 | |
| Bars, Carbon | Monthly % chg. | +0.9 | +0.8 | +1.0 | +0.9 | +5.6 | +0.9 | +0.6 |
| Annual % chg. | +5.9 | +6.7 | +7.5 | +8.3 | +13.7 | +14.6 | +14.2 | |
| Bituminous Concrete | Monthly % chg. | +0.7 | +2.6 | +1.5 | +1.6 | –0.3 | –0.3 | –1.2 |
| Annual % chg. | +1.7 | +5.6 | +7.0 | +8.3 | +6.2 | +6.1 | +4.2 | |
| Bricks | Monthly % chg.. | +0.1 | +0.7 | –0.3 | +0.2 | +0.1 | +0.3 | 0.0 |
| Annual % chg. | +0.9 | +1.6 | +1.3 | +1.3 | +1.1 | +0.9 | +1.0 | |
| Cement | Monthly % chg. | 0.0 | +0.1 | 0.0 | –0.4 | +0.6 | –0.1 | –0.1 |
| Annual % chg. | +1.5 | +1.8 | +2.2 | –0.9 | –0.5 | -+0.5 | –0.5 | |
| Copper, Pipe And Tube | Monthly % chg. | +1.3 | +0.4 | –1.0 | +0.7 | –2.1 | +5.1 | –0.3 |
| Annual % chg. | –5.1 | –4.7 | –9.7 | –8.6 | –9.1 | –6.0 | –4.7 | |
| Culvert Pipe | Monthly % chg. | 0.0 | 0.0 | +1.9 | +0.2 | –0.2 | +0.0 | 0.0 |
| Annual % chg. | +1.7 | +1.8 | +1.9 | +2.1 | +1.9 | +1.8 | 1.8 | |
| Diesel Fuel | Monthly % chg. | +12.3 | +26.9 | +4.5 | –20.9 | –14.4 | +2.6 | +3.2 |
| Annual % chg. | +65.7 | +106.4 | +85.6 | +33.0 | +17.2 | +22.5 | +19.6 | |
| Fabricated Pipe Fittings | Monthly % chg. | 0.0 | +0.1 | +0.7 | +0.7 | –0.3 | –0.1 | –0.9 |
| Annual % chg. | +1.7 | +2.1 | +2.5 | +3.1 | +2.5 | +2.6 | +0.9 | |
| Fabricated Steel, Bldg. | Monthly % chg. | –0.4 | –0.2 | –0.1 | –0.5 | +0.1 | –0.2 | +0.4 |
| Annual % chg. | –3.4 | –3.0 | –3.0 | –3.6 | –3.4 | –3.2 | –2.6 | |
| Glass, Flat | Monthly % chg. | –1.4 | +0.8 | –0.3 | 0.0 | +1.0 | –0.3 | +0.7 |
| Annual % chg. | –0.2 | +0.6 | +1.0 | +0.7 | +2.1 | +1.1 | 0.0 | |
| Gravel | Monthly % chg. | +0.4 | 0.0 | +0.1 | +0.1 | +0.5 | +0.4 | +0.4 |
| Annual % chg. | +1.6 | +1.1 | +1.6 | +1.5 | +1.4 | +1.5 | +2.0 | |
| Gypsum Products | Monthly % chg. | –2.1 | +1.8 | –3.3 | +5.3 | –0.6 | –3.8 | +5.1 |
| Annual % chg. | +1.9 | +2.8 | +2.0 | +5.5 | +0.4 | –3.9 | +4.6 | |
| Insulation | Monthly % chg. | +0.8 | +2.7 | –1.1 | –0.9 | 0.0 | –0.7 | –0.7 |
| Annual % chg. | +0.1 | +4.9 | +2.9 | +2.6 | –0.1 | 0.0 | –0.7 | |
| Lumber, Softwood | Monthly % chg. | 0.0 | +2.0 | –2.1 | –0.4 | –0.4 | +1.2 | +4.0 |
| Annual % chg. | –1.8 | –2.6 | –7.7 | –8.0 | –6.9 | –3.1 | +0.7 | |
| Paint | Monthly % chg. | +0.2 | +0.5 | +0.1 | +0.1 | +1.2 | –0.2 | +0.4 |
| Annual % chg. | +1.3 | +1.8 | +1.7 | +1.3 | +2.9 | +2.5 | +2.9 | |
| Plumbing Fixture | Monthly % chg. | 0.0 | +0.4 | 0.0 | 0.0 | +0.2 | –0.1 | 0.0 |
| Annual % chg. | +0.9 | +1.1 | +1.0 | +1.0 | +1.1 | +0.9 | +0.9 | |
| Plywood | Monthly % chg. | –0.3 | +0.9 | –0.8 | –0.1 | –0.2 | +2.4 | +8.8 |
| Annual % chg. | –1.6 | –2.8 | –8.9 | –8.5 | –4.5 | –2.8 | +7.6 | |
| PVC Pipe | Monthly % chg. | +1.0 | +1.0 | +1.1 | +1.1 | –0.1 | –0.4 | –1.3 |
| Annual % chg. | +4.5 | +4.0 | +4.4 | +4.7 | +2.5 | +0.3 | –1.4 | |
| Ready-Mix Concrete | Monthly % chg. | +0.1 | –0.1 | +0.3 | 0.0 | +0.3 | 0.0 | –0.2 |
| Annual % chg. | –1.2 | +0.1 | +0.5 | 0.0 | +0.4 | +0.6 | +0.5 | |
| Reinforcing Bars | Monthly % chg. | –0.2 | –0.1 | +7.5 | +0.5 | +0.4 | +0.2 | –0.1 |
| Annual % chg. | +1.6 | +0.4 | +7.0 | +7.2 | +7.6 | +6.9 | +7.0 | |
| Sand | Monthly % chg. | +0.2 | +0.4 | –0.4 | +0.9 | +0.4 | +0.4 | –0.1 |
| Annual % chg. | +0.8 | +1.2 | +0.6 | +1.0 | +1.5 | +2.0 | +1.7 | |
| Sewer Pipe | Monthly % chg. | +1.9 | 0.0 | +1.2 | 0.0 | –0.7 | +0.2 | 0.0 |
| Annual % chg. | +2.5 | +2.9 | +3.4 | +3.4 | +2.8 | +2.0 | +2.0 | |
| Sheet Metal | Monthly % chg. | +0.3 | +0.1 | –0.1 | 0.0 | +0.1 | +0.1 | –0.1 |
| Annual % chg. | +2.2 | +2.2 | +1.8 | +1.6 | +1.4 | +1.0 | +0.1 | |
| Stainless Steel | Monthly % chg. | –0.1 | +0.6 | +0.4 | +2.1 | –0.5 | –0.4 | +0.6 |
| Annual % chg. | +4.5 | +5.6 | +4.0 | +5.3 | +3.8 | +1.9 | +1.8 | |
| Source: Bureau of labor statistics, NA= Not available | ||||||||
![]()
Indexes: Tight Markets Squeeze Margins
Materials: Perfect Storm Blows Prices Sky-High
Equipment: Fighting Rising Insurance Rates
Labor: Unemployment Fails to Dent Wage Hikes
Insurane: Pressure Grows on Workers' Comp