Summary: Strong Volume, Weak Prices
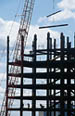 |
| (Photo by Michael Goodman for ENR) |
Economists are predicting that overall construction in 2002 will be close to last year's record volume and with a little bit of luck it could even eke out a small gain. But while volume is near its peak, the selling price of construction is more reminiscent of a recession. The steep falloff in several private nonresidential building markets has contractors migrating to where the work is and cutting their margins to get it.
"Competition is intense and it is driving prices down, especially for electrical and mechanical work," says Paul Nash, director of cost management for Gardiner & Theobald's New York City office. G&T is seeing bids for electrical work 10 to 15% lower than a year ago. "At the moment we are putting very little into our escalation estimates," Nash says.
This competitive pricing is reflected in the industry cost indexes compiled for this cost report. Nine general purpose cost indexes, which measure the input cost of labor and materials, are averaging annual increases of 2.2%. This is virtually the same rate of inflation as last year.
Indexes that measure the selling price of construction show a different story. The Turner Corp.'s selling price index shows an annual increase of just 0.7% this quarter, down from a 1.8% rate of increase for the same period in 2001. The spread between the selling price and general purpose indexes is a good indicator of the degree of discounting going on in today's market.
"Basic cost increases are around 3 to 4% but there is enough pressure to discount at least half of that," says Julian Anderson, president of Rider Hunt Levett & Bailey, Phoenix. "We recently saw a spike in structural steel prices but with the number of bidders interested in our project the price came back down dramatically."
The labor market also is responding to the competitive environment, both at the executive compensation and craft worker level. At design firms, most classes of managers have seen a flattening out of their salaries and bonuses are being trimmed back.
Wage settlements for union workers eased this year to a 4.2% average annual increase for new wage and fringe benefit packages, according to the Construction Labor Research Council, Washington, D.C. While still one of the larger increases recorded during the last decade, 2002's settlements were down from last year's 4.6% wage hike, says CLRC. ENR tracked a 4.2% increase in wages for laborers and a 4.5% average increase for skilled workers.
Lower materials prices negated much of the impact of these wage increases on ENR's indexes. After a first quarter spike, lumber prices fell steadily through the rest of 2002 and structural steel prices were undermined by the collapse of the office building market. Lower lumber and steel prices combined to keep the annual increase for ENR's Building Cost Index at 1.8% and the Construction Cost Index at 2.7%.
Inflation rates also were modest in most other areas of the world, according to ENR's annual survey of international construction costs, conducted by Gardiner & Theobald Inc., London. Global inflation is predicted to fall to 2.7% in 2003, according to 17 countries that provided forecast data. This would be down from the 3.0% increase in construction costs reported by this same group of countries for 2002.
In the U.S., inflation for the construction industry in 2003 should remain close to this year's trends, according to cost forecasts by ENR and Global Insights Inc., formerly DRI-WEFA. ENR's forecast is for the CCI to increase 3.1% next year while the BCI climbs 2.3%.
Global Insights believes weaker demand will keep materials prices in line in 2003. "Housing starts next year will decline 6.8% from 2002's level and nonresidential building will continue to suffer," says Amy Carneal, an economist for Global Insights. The slowdown in housing will stall a rebound in gypsum wallboard prices, which will increase 7.2% this year after falling 21.3% in 2001.
Despite lower demand, wallboard producers should still manage to move prices higher next year. "Wallboard producers are gaining more control over production by closing older plants as they bring new efficient plants on line," says Carneal. She expects wallboard producers to decrease production by 0.8% next year, creating enough room for a modest 2% price increase.
Chronic overcapacity will prevent the lumber industry from following suit. "Lumber prices have fallen significantly this year despite a 3% increase in demand," says Paul Jannke, vice president of wood products for Resource Information Systems Inc., a Bedford, Mass.-based forecasting firm. "With demand falling next year, there is no reason [lumber] prices should move up except for short-term factors."
This year, western spruce 2x4 prices peaked in March at $295 per thousand bd ft, then plunged 37% to last month's low of $187, says RISI. Seasonal inventory buildup should push prices back to $250 in the first quarter of next year before they start tumbling again. "Once prices get around $250 the production is just going to swamp any kind of demand that is out there," says Jannke.
In addition, the 27.2% tariff on imports of Canadian lumber is proving to be ineffective in propping up prices. "The volume of imports from Canada has not decreased," says Burrle Elmore, editor of Eugene, Ore.-based Random Lengths, which tracks lumber prices. "In reality it is having the opposite effect as Canadian manufacturers increase production to lower their unit costs."
RISI predicts prices for western spruce 2x4s next year will average 5% lower than 2002. Global Insights is forecasting a 4.1% decline in lumber prices in 2003 and ENR is looking for the lumber component in its indexes to decline another 4.5%.
Structural steel prices did not win the tariff protection from imports that was granted for many sheet and plate products. As a result, prices for fabricated structural metal increased just 0.2% this year, according to the Bureau of Labor Statistics. Global Insights is forecasting only a 0.7% price increase for fabricated structurals next year. ENR calls for the wholesale price for structural steel it tracks to rebound 1% next year after falling 4.5% during 2002.
Cement prices also are expected to make only modest gains in 2003. The Portland Cement Association, Skokie, Ill., is forecasting a 1.1% decline in cement consumption next year. In addition, producers are still bringing on line new capacity, says PCA Chief Economist Ed Sullivan. ENR predicts that lower demand and more supply will hold next year's price increase to 1.5%.
|
Parity Index Adjusts for Swings in Exchange Rates The Hanscomb/Means Parity Index was designed to clarify the international cost picture, which can be distorted by gyrations in currency exchange rates. The index is based on put-in-place rates for 26 basic items used in the construction of a manufacturing facility. The parity index value in the table shows construction costs at each location relative to Chicago. A parity of 0.88 for Great Britain implies that �0.88 of construction is equivalent to $1.00 of work in Chicago. To calculate a relative index value, divide the parity value of the exchange rate and multiply by 100. In this study, the U.S. dollar is used as the exchange rate for Russia. For example, if a manufacturing facility costs $575 per sq m in the U.S., what would be the approximate cost in Great Britain? Average parity is �0.83 = $1. So, 0.83 x $575 = �477 per sq m. Purchasing parity provides a useful means of comparison since exchange rates can fluctuate significantly, yet the actual in-country costs of goods remain unchanged. Using parities also avoids problems arising from thinking in terms of a fixed percentage difference between countries, which inevitably happens with indexes.
|
||||||||||||||||||||||||||||||||||||||||||||||||||||||||||||||||||||||||||||||||||||||||||||||||||||||||||||||||||||||||||||||||||||||||||||||||||||||||||||||||||||||||||||||||||||||||||||||||||||||||||||||||||||||||||||||||||||||||||
Click here for FORECAST: Soft Markets Sap Inflation >>
Click here for COMPENSATION: Salary Hikes Take a Holiday >>
Click here for WALLBOARD: Europe Fines Big Producers >>
Click here for INTERNATIONAL: Inflation Rolled Back Again >>