Construction Safety
Construction Posts Non-Fatal Injury Rate Decline, But Injuries Rise

Construction’s 2017 results mark its third-straight year-over-year decline in injuries and illnesses, after a 1.9% increase in 2015.
Image courtesy of Pixabay
Nonfatal construction industry injuries and illnesses on the job declined in 2017 and the injury rate also was down, the federal Bureau of Labor Statistics has reported.
Despite those positive results, industry officials say more needs to be done on the safety front and the building trades’ safety and health director points out that some construction sectors’ rates are worse than the industry's overall national rate.
The latest BLS annual injury-illness report, released on Nov. 8, shows that there were an estimated 198,100 such cases in construction workplaces in 2017, down 2.7% from the 2016 level.
The data are based on reports from employers.
 Construction’s 2017 results mark its third-straight year-over-year decline in injuries and illnesses, after a 1.9% increase in 2015.
In addition, BLS statistics show that the estimated 2017 nonfatal injury rate per 100 full-time workers also edged down, to 3.1 per 100 full-time workers, from 3.2 in 2016.
That indicator also has shown modest annual improvements in recent years, dropping from 3.6 in 2014, to 3.5 in 2015 and 3.2 in 2016.
Looking for quick answers on construction and engineering topics?
Try Ask ENR, our new smart AI search tool.
Ask ENR →
Greg Sizemore, Associated Builders and Contractors vice president of health, safety education and workforce development, said in comments emailed to ENR, “While we’re encouraged to see these numbers ticking downwards, the only acceptable number of workplace injuries on a construction jobsite is zero.”
Brian Turmail, spokesman for the Associated General Contractors of America, says, “The fact that both the injury number and the injury rate are going down—despite the increased demand for construction [and] the fact that we’ve got a lot of newer and less-experienced people coming into the industry—tells us that, while we’ve still got a long way to go, we are as an industry making progress in creating safer work spaces for all employees.”
Construction also ranked sixth among U.S. industries in 2017 nonfatal injuries and sicknesses. [View BLS charts here. See p. 3 for industry-by-industry comparisons.]
Health care had the highest total, with 582,500, followed by manufacturing, with 426,900, retail trade, at 395,700, accommodations/food services with 262,600 and transportation and warehousing, at 215,700.
Moreover, Chris Trahan Cain, North America’s Building Trades Unions’ director of safety and health, points out that though construction’s overall nonfatal injury rate was the same as the all-industry rate, construction’s rate of severe cases—those that lead to days away from work—was 1.2 per 100 workers, 20% above the 1.0 rate for all U.S. industries.
In emailed comments to ENR, Cain also noted that some construction segments’ injury-illness rates were much higher than the 3.1 overall rate. She cited framing contractors’ 7.5 rate, which is by far the highest among construction categories. Structural steel-precast concrete contractors’ rate was 4.9 and roofing contractors rate was 4.4.
“More targeted preventions are needed,” Cain said.
Cain said that the number of construction workplace fatalities increased 5% in 2016, the most recent numbers from BLS. [See ENR December 2017 story here.]
Sizemore said that initiatives like ABC’s Safety Training Evaluation Process have shown positive results.
He said, “By implementing proactive safety practices and leading indicators—such as substance-abuse programs, new-hire safety orientation and near-miss investigations, companies report a reduction of recordable incidents by up to 85%.
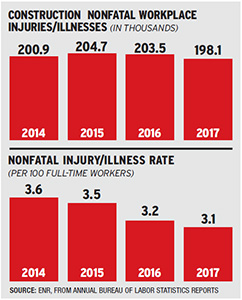
Numbers of construction workplace injuries/illnesses:
(in thousands)
2017: 198.1
2016: 203.5
2015: 204.7
2014: 200.9
Injury rate
(per 100 fulltime workers)
2017: 3.1
2016: 3.2
2015: 3.5
2014: 3.6
Source: ENR, from annual Bureau of Labor Statistics reports

