In the aftermath of Hurricane Harvey’s assault on Texas and Louisiana, drones and small planes equipped with cameras and instruments fill the sky, getting a bird’s-eye view of the destruction. And new advances in photogrammetry are making their images increasingly valuable to assessors and rebuilders.
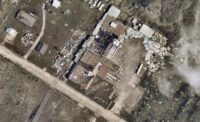
Aerial imaging firm Nearmap focuses on not just capturing photos but also deliverables useful to the construction industry. Working from images captured by regular flyovers, the firm is able to generate high-resolution aerial imagery that can be imported into CAD programs for reference during repairs and reconstruction after a storm.
“With Nearmap, construction and engineering firms focused on rebuilding infrastructure after Hurricane Harvey can instantly access current imagery for areas damaged by the hurricane,” says Tony Agresta, vice president of marketing for Nearmap. “Construction professionals can collaborate within their company or with design and civil engineering partners—all of which see the exact same location content.”
The use of sensor technology to assess damage after a hurricane also can bring unexpected results, as Chris Milliner, a postdoctoral fellow at NASA’s Jet Propulsion Laboratory at the California Institute of Technology, found. Analyzing data from the Nevada Geodetic Laboratory and the University of Nevada-Reno’s statistics department, Milliner found that the Houston area was two centimeters lower than before the storm. “GPS shows [Harvey’s flooding] was so large, it flexed the Earth’s crust, pushing Houston down by 2 cm,” Milliner posted to Twitter on Sept. 4. In further explaining his findings to reporters, he said it was unlikely that this change represented soil subsidence, as many of the monitors involved were placed directly onto bedrock; rather, it was similar to the local elasticity of the Earth’s crust normally seen in seasonal changes in water and ice. “This should be a temporary drop,” he told reporters. “Once floodwaters recede, we should expect a similar, but opposite elastic response of the crust, i.e., uplift. Similar to if you were to jump on and off your mattress.”
The use of before-and-after data on storms is tried and true, but as data gathering grows more sophisticated, assessing the scale of the damage and pinpointing the areas and structures most in need of repair is accelerated. Nearmap’s approach is to gather as much aerial imagery of urban areas as possible in an ever-expanding library. This lets the firm provide relatively recent images of sites when requested, rather than having to arrange flyovers for every job. In the case of Harvey, the company made an exception and got planes in the air a few days after the storm’s passage.
Agresta thinks that, in the case of Harvey, relatively recent flyovers conducted by the company may prove invaluable in the rebuilding effort. “Nearmap high-resolution aerial maps allow users to show change over time, including 2017 and 2016,” he explains. With geotagged images, contractors, owners and disaster-response crews can pinpoint the worst-hit areas and better plan for the rebuilding phase after cleanup. Nearmap imagery “can be exported or directly accessed via APIs within CAD products or mapping tools such as Esri,” he says.


Post a comment to this article
Report Abusive Comment