Powerful New Tool Is Key To Reducing Risk
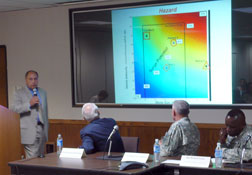 Angelle Bergeron/ENR Link, left, unveils the risk analysis tools in New Orleans with top officials at hand. |
Planners and citizens of New Orleans now have a powerful new tool to guide their reconstruction decisions, a flood-risk analysis system developed by scientists working for the U.S. Army Corps of Engineers. The system has evolved from a growing understanding of hurricanes and the performance of storm defenses engineered to resist them. And while its first application is to hurricane floods in New Orleans, officials say it could be applied to improving the performance of natural-hazard defenses anywhere.
“This is a prototype risk model, something that works now but will be refined over time,” said Lt. Gen. Robert Van Antwerp, Corps commander and chief of engineers, when the tool was unveiled in New Orleans on June 20. “We will use it, learn from it as we go and see if we can apply it to other areas. It’s fitting that the people in southeast Louisiana will be first, but I can’t help but dream that everyone in the rest of the country who has a levee or any feature that protects them won’t benefit from this.”
| + click to enlarge |
 Risk map for Lakeview prior to Katrina (upper left) shows the basin had a 1% chance of deep flooding annually. After improvements, deep flood risk is much reduced. (Image: Army Corps of Engineers) |
The system applies powerful com-puter modeling to weigh the annual probability that a hazardous situation will develop against the reliability of the protective infrastructure built to resist it. Its veracity depends on detailed data about the design, engineering, construction and maintenance of the protections, as well as the validity of models of the range of hazardous loads that may assault them. To deliver a quantified measure of risk, the tool then factors in consequences of failure, in terms of lives and property that would be exposed by failure at that location.
Ed Link, director of the Interagency Performance Evaluation Task Force, from which the risk and reliability tools have evolved, says the key is to carry the process through to an expression of risk. That helps planners prioritize the work they need to do and predict the impact. IPET was a forensic study convened by the Corps to find out why Hurricane Katrina caused such destruction. The risk tools now being introduced leverage the enormous amount of thought, data and sophisticated modeling that has gone into IPET’s work.
|
Link says the process can be expressed as a formula: Risk=PxVxC, where P is the probability of the hazardous event, V is the vulnerability of the defensive system, and C represents the consequence of failure. If engineers can reduce the vulnerability, then the calculated risk in terms of losses to lives and property in that location will be driven down.
“We never really did have a good way to tell people, ‘Here is your risk, right now,’” says Maj. Gen. Don T. Riley, the Corps deputy chief in charge of civil works. “There is a great deal of excitement about this. I sense we are at one of those strategic inflection points and are on the verge of a major shift in engineering practice and policy.”
| + click to enlarge |
 Lakeview—A similar 1%-chance-of-flood risk map of the Lakeview basin as it was prior to Katrina shows near total, deep inundation. (Image: Army Corps of Engineers) |
Prioritizing
In lightly populated areas, decreasing the chances of flooding by improving levees may not actually do much to reduce risk, since there are few lives and little improved property at stake, Link says. Similarly, isolated improvements that fail to address the need to coordinate defenses in a given basin also have little effect on risk. But in a heavily populated urban area, the same investment in well-planned, coordinated improvements could have a significant impact on economic security and public safety. The new tool is designed to communicate such differences to the public and policy-makers through map-based displays.
“This will be an unbelievable tool for understanding risk when people are deciding where and how to build,” says Donald Powell, federal coordinator of Gulf Coast Rebuilding. Powell is charged with developing a long-term rebuilding plan for the region. He also coordinates federal efforts to help state and local officials reach consensus on reconstruction.
| + click to enlarge |
 Lakeview Today—Storm gates and floodwall improvements since the storm have reduced flood probability more substantially in Lakeview than Gentilly, the scientists calculate. One reason given for the disparity between the two neighborhoods is that the defenses on the east side of Gentilly still have substantial vulnerability to overtopping or structural failure along the Inner Harbor Navigational Canal. If engineers strengthen defenses there, the calculated flood exposure will go down. (Image: Army Corps of Engineers) |
Adaptable
The tool was developed to be generic so that it could be applied to a variety of risks. “This is a tool that we will learn to use more effectively and efficiently, and there will be a national capability that will be evolved from this,” Link says.
But putting it to use will require a significant accumulation of engineering data. In the New Orleans area, Link says the tool relies on data gathered by IPET about the vulnerability of the hurricane protection system in each of the 37 sub-basins of southeast Louisiana that are threatened by a wide range of possible hurricanes. Its analysis is based on computer-generated models of 25-year to 5,000-year storms, following 152 different tracks and hydrographs at 138 different locations. Link says the model is the most accurate tool that has ever existed for predicting the intensity and effects of future hurricanes in the Gulf.
Lt. Col. David Berczek, the Corps’ leader on risk analysis, says the risk products also can be focused on specific concerns, such as vulnerability of specific features in the hurricane protection system, including pumps, gates or transitions from one type of structure to another. Its flood-depth prediction accuracy is plus or minus one foot, he says.
| + click to enlarge |
 Targeting improvements to New Orleans’ flood defenses will be focused with risk analysis. Targeting improvements to New Orleans’ flood defenses will be focused with risk analysis.(Image: Army Corps of Engineers) |
Illustrations
Sample sets of risk maps that were presented with the introduction of the tools compare two similarly populated subbasins in Orleans Parish. They show how flood-protection improvements implemented since Katrina have reduced risk. One set is of the Gentilly neighborhood, which was flooded by failures of floodwalls and levees on the Inner Harbor Navigation Canal on the east side and also on the London Avenue outfall canal on the west. The other is the Lakeview neighborhood, which was inundated by the failure of a floodwall on the 17th Street Canal.
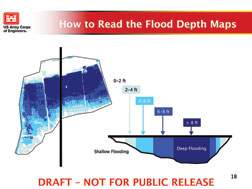
Web-accessible maps posted by the Corps at http://NOLArisk.usace.army.mil show high-resolution street maps of those neighborhoods overlaid with color coding. They show flood levels that have a 1% chance of occurring in any given...