A Stalled Recovery Ready To Rev Up
...and I don’t see anything on the horizon that is going to give us that big lift,” says Ed Sullivan, PCA’s chief economist.
After adjusting for inflation, the PCA expects total construction put-in-place to increase just 0.1% next year, after falling 7.1% in 2010. PCA agrees with most other forecasts that the non-residential building market will still be down next year, calling for another 4% decline in that market following this year’s 33% decline. PCA is a bit more pessimistic in its public construction and housing forecasts.
With stimulus funds fading and state and municipal governments struggling, PCA expects total public construction to fall 1.2% in 2011, after inching up just 0.1% this year. “Given the fiscal problems with most states, we can’t expect them to extend their construction activity in 2011,” says Sullivan. “And with the political changes, we don’t see a new highway spending bill until 2013, which leaves us at last year’s level or worse,” he adds.
In the homebuilding market, PCA predicts only a 3.8% increase next year. “It is true that there is pent-up demand and the prices are becoming more affordable, but that will be offset by foreclosure activity,” Sullivan says. “We see slower economic growth, and that means job creation will be slower and the potential for defaults remains high.”
The Housing Question
After modest improvement in single-family housing starts this year, the sector could make significant gains in the coming years, according to the National Association of Home Builders. NAHB chief economist David Crowe estimates 2010 will close with an 8% increase in single-family home construction starts to 479,000 units, less than originally forecast for the year. “The [economic] lull in the middle of the year took a lot more wind out of the sails than expected,” he adds.
Crowe notes that many potential buyers remain on the sideline because of concerns about their financial situation and because they can’t sell their own homes. Between hesitant owners and a tough lending climate, existing inventory of new unsold homes is at its lowest level since 1968.
However, improved employment numbers and looser lending could help spark a rebound. Crowe sees a significant pickup in activity in single-family housing starts, with 655,000 in 2011 and 970,000 in 2012—a nearly 100% jump from 2010 figures.
Meanwhile, multifamily housing has already started to recover. NAHB forecasts that 2010 will end with a 12% rise to 125,000 units and could rise another 19% to 149,000 units in 2011. Crowe says demand in the rental sector has helped drive the increase, as many who struggle to get loans are forced to rent rather than buy.
Highway Funding
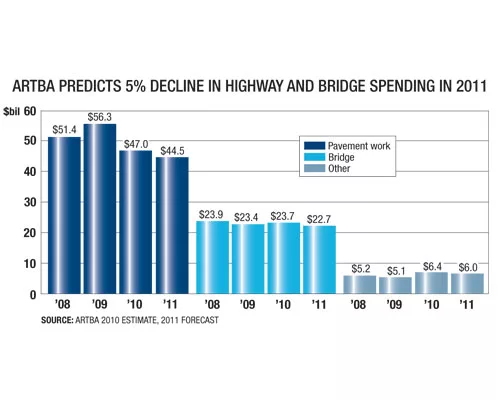
As the last of the stimulus funds moves through state departments of transportation, highway and bridge budgets are about to reach a harsh reality. With much of the stimulus funding directed toward shovel-ready projects, paving work could see the biggest correction, according to the American Road & Transportation Builders Association. ARTBA estimates that spending on paving work will drop 17% this year to $47 billion, and it will drop an additional 5% in 2011 to $44.5 billion.
Bridge funding remains relatively flat. After rising 1% to $23.7 billion this year, it is expected to drop to $22.7 billion in 2011. ARTBA senior economist Alison Premo Black says that, even in the face of the recession, bridge work remains stable because projects tend to pay out over longer periods of time. Plus, bridge work didn’t receive the same big spike from the stimulus that was seen with paving projects.
Other transportation-related projects, such as sidewalks, lighting systems and toll facilities, are expected to drop from $6.4 billion this year to $6 billion in 2011, ARTBA predicts.
Black says the forecast assumes 2011 federal transportation spending will come in at around $43.5 billion, which is based on levels previously discussed in Congress this year. State and local spending, which has been hampered by drops in tax revenue, also is uncertain but could improve next year, she says. Black notes that nearly half the states have shown increases in contract awards this year.
“It’s a conservative forecast, but if the economy improves, perhaps we could see increased spending at the state and local levels,” she says. “Some states are already seeing growth, so there are some positive signs. Will it be enough? We don’t know.”
| ACTUAL | ESTIMATE | FORCAST | PERCENT CHANGE | ||
|---|---|---|---|---|---|
| TYPE OF CONSTRUCTION | 2009 | 2010 | 2011 | 09-10 | 10-11 |
| TOTAL CONSTRUCTION | 420,691 | 411,275 | 445,525 | -2.2 | +8.0 |
| RESIDENTIAL | 111,755 | 119,100 | 150,375 | +6.6 | +26.0 |
| Single-Family Housing | 94,341 | 100,025 | 126,725 | +7.1 | +27.0 |
| Multifamily Housing | 17,414 | 19,075 | 23,650 | +9.5 | +24.0 |
| NON-RESIDENTIAL | 167,537 | 150,875 | 156,850 | -10.0 | +4.0 |
| Office Buildings | 19,954 | 15,375 | 17,300 | -23.0 | +13.0 |
| Hotels and Motels | 4,587 | 3,150 | 3,575 | -31.3 | +13.0 |
| Stores and Shopping Centers | 13,219 | 12,250 | 13,925 | -7.3 | +14.0 |
| Other Commercial | 8,965 | 8,050 | 10,100 | -10.2 | +25.0 |
| Manufacturing | 9,662 | 8,475 | 9,250 | -12.3 | +9.0 |
| Educational Buildings | 48,090 | 44,075 | 43,575 | -8.4 | -1.0 |
| Health-Care Facilities | 20,178 | 21,075 | 22,900 | +4.5 | +9.0 |
| Other Institutional Buildings | 42,882 | 38,425 | 36,225 | -10.4 | -6.0 |
| NON-BUILDING CONSTRUCTION | 141,399 | 141,300 | 138,300 | -0.1 | -2.0 |
| Highways and Bridges | 56,899 | 59,700 | 57,600 | +4.9 | -4.0 |
| Environmental Public Works | 36,270 | 36,900 | 37,200 | +1.7 | +1.0 |
| Other Public Works | 28,451 | 27,000 | 27,500 | -5.1 | +2.0 |
| Electric Utilities | 19,779 | 17,700 | 16,000 | -10.5 | -10.0 |
| Source: McGraw-Hill Construction. Figures for 2011 are estimated. | |||||
| ACTUAL | ESTIMATE | FORCAST | PERCENT CHANGE | ||
|---|---|---|---|---|---|
| TYPE OF CONSTRUCTION | 2009 | 2010 | 2011 | 09-10 | 10-11 |
| TOTAL CONSTRUCTION | 907,787 | 842,216 | 881,070 | -7.0 | +5.0 |
| total RESIDENTIAL | 253,576 | 268,659 | 297,882 | +6.0 | +11.0 |
| Single Family | 107,325 | 123,424 | 148,109 | +15.0 | +20.0 |
| Multifamily | 32,224 | 20,946 | 19,270 | -35.0 | -8.0 |
| Home Improvement | 114,027 | 124,289 | 130,504 | +9.0 | +5.0 |
| TOTAL NON-RESIDENTIAL | 437,183 | 360,313 | 357,102 | -18.0 | -1.0 |
| Lodging | 25,474 | 14,011 | 14,018 | -45.0 | 0.0 |
| Office | 52,717 | 36,902 | 35,426 | -30.0 | -4.0 |
| Amusements and Recreation | 18,901 | 15,499 | 15,809 | -18.0 | +2.0 |
| Religious | 6,206 | 5,399 | 5,507 | -13.0 | +2.0 |
| Education | 102,907 | 92,616 | 95,395 | -10.0 | +3.0 |
| Health Care | 45,111 | 41,051 | 43,104 | -9.0 | +5.0 |
| Commercial | 55,042 | 37,979 | 35,700 | -31.0 | -6.0 |
| Manufacturing | 58,513 | 42,129 | 33,703 | -28.0 | -20.0 |
| Public Safety, Administrative | 14,099 | 13,676 | 14,086 | -3.0 | +3.0 |
| Transportation | 38,459 | 43,074 | 45,659 | +12.0 | +6.0 |
| NON-BUILDING STRUCTURES | 217,028 | 213,245 | 226,086 | -2.0 | +6.0 |
| Conservation and Development | 5,624 | 6,636 | 7,167 | +18.0 | +8.0 |
| Highways and Streets | 82,028 | 82,110 | 85,394 | 0.0 | +4.0 |
| Sewers Systems | 24,410 | 24,898 | 25,894 | +2.0 | +4.0 |
| Power | 89,405 | 84,041 | 91,604 | -6.0 | +9.0 |
| Water Supply | 15,561 | 15,559 | 16,026 | 0.0 | +3.0 |
| Source: FMI corp., raleigh, N.C. Historical data is compiled from building permits, construction-put-place and trade-source estimates for 2010, as well as a forecast for 2011 by fmi. | |||||
| ACTUAL | ESTIMATE | FORCAST | PERCENT CHANGE | ||
|---|---|---|---|---|---|
| TYPE OF CONSTRUCTION | 2009 | 2010 | 2011 | 09-10 | 10-11 |
| TOTAL CONSTRUCTION | 552.4 | 513.4 | 514.0 | -7.1 | +0.1 |
| TOTAL RESIDENTIAL BUILDING | 167.6 | 172.3 | 178.9 | +2.9 | +3.8 |
| TOTAL NON-RESIDENTIAL BUILDING | 132.9 | 89.6 | 86.1 | -32.5 | -4.0 |
| Industrial | 33.0 | 19.9 | 19.2 | -39.7 | -3.5 |
| Office | 23.5 | 15.0 | 15.0 | -36.1 | -0.3 |
| Hotels, Motels | 15.8 | 7.3 | 6.7 | -53.8 | -8.2 |
| Hospitals, Institutions | 17.8 | 16.1 | 16.2 | -9.3 | +0.5 |
| Religious and Miscellaneous | 3.8 | 3.3 | 3.1 | -13.0 | -6.0 |
| Educational | 9.1 | 7.6 | 7.1 | -16.7 | -6.7 |
| Commercial | 25.0 | 16.4 | 15.0 | -34.4 | -8.5 |
| PUBLIC UTILITY | 63.9 | 62.3 | 61.8 | -2.5 | -0.8 |
| PUBLIC CONSTRUCTION | 184.3 | 184.4 | 182.1 | +0.1 | -1.2 |
| Buildings | 74.6 | 68.2 | 65.9 | -8.7 | -3.3 |
| Highways and Streets | 45.1 | 47.4 | 47.8 | +5.1 | +0.9 |
| Conservation | 3.6 | 3.9 | 3.9 | +9.2 | +0.9 |
| Sewer Systems | 15.4 | 16.2 | 16.1 | +4.7 | -0.2 |
| Water Supply | 9.8 | 9.7 | 9.3 | -1.5 | -4.6 |
| Military/Miscellaneous | 27.9 | 31.9 | 32.1 | +14.3 | +0.6 |
| Source: Portland Cement Association skokie, Ill. | |||||


