Maturing Visualization Tools Make Ideas Look Real
...constructibility–heading off some show-stopping issues in the process–and studying 4-D modeling of the sequence, the team grew convinced it could be done. And it was. In fact, it was completed 14 hours early.
Another big user of visualization is Walt Disney Imagineering, Glendale, Calif., designer and construction manager for such projects as the gut-renovation of Disney’s Space Mountain adventure ride at Disneyland, in Anaheim, Calif., and the ongoing construction of Mt. Everest Expedition at Disney’s Animal Kingdom in Orlando, Fla.
The "Imagineers" design and plan in 4-D and study preconstruction visualizations to confirm details and execution strategy. They use imagery to communicate "the big idea" to corporate leaders they must satisfy, but also to contractors with whom they work. "It is really cool to show these guys the puzzle pieces in advance," remarked planner Brian Ford during another CIFE presentation. He said the team frequently generates labeled stills to clarify procedures, and prints them out for the crews in the field.
"Anything that helps them plan and helps them in terms of cost, helps us in the long run," says Frank Addeman, WDI vice president for planning and scheduling.
Satisfying Stakeholders
John Kruk, a project engineer on the Metropolitan Transit Authority/New York City Transit Authority’s $785-million overhaul of the Fulton Street Transit Center in lower Manhattan, also has much recent experience using visualization tools to explain the project to its many stakeholders. Kruk is part of a Parsons Brinckerhoff/Bovis Lend Lease joint venture providing preconstruction and construction management services. The transfer center, where 11 subway lines converge around eight scattered platforms connected by a maze of passageways, serves about 275,000 riders daily. One of the most complex subway stations in the city, it is to be rebuilt without interrupting passenger operations or closing streets above.
 |
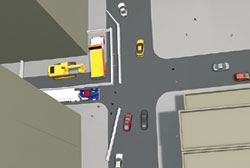 |
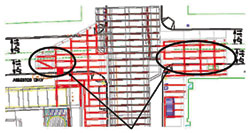
| Merchant Relief. Graphics proved to merchants that traffic can continue to flow while steel is replaced below. (Graphics courtesy of MTA/NYCTA, PB/Bll JV) |
Merchants had to be convinced that the contractor could maintain an 11-ft traffic lane while replacing the steel supporting the street. The owner must buy the design and construction plan, including column relocations and a sequence of pedestrian reroutings that include temporary reversals of direction and the building of several sets of temporary stairs.
Digital models founded on an Autodesk Architectural Desktop base are being used to generate many images for both the public and the official overseers. They include a sequence of renderings of the street lane-closing plan, as well as underground views and a set of movies showing the sequence of pedestrian pattern changes.
"I think they are fairly valuable," says Kruk. "It’s easier to see what’s going on. When you have the two-dimensional drawings and the schedule and everything is separate it’s not always easy to picture what will actually be happening when. With this, you get a better sense of what the owner’s paying for. They know what to expect, but once they see it, they say, ‘Oh, that’s what’s happening.’"
One researcher who has made a study of how project meetings actually process information is Kathleen Liston, a civil engineering doctoral candidate at Stanford whose work has included detailed analysis of more than 40 such meetings. She has found that in conventional sessions with paper-based presentations, 40% of the time is spent describing the "who, what, where, when and how" of the project, 20% explaining the rationale of decisions already made, 30% evaluating goals to be sure requirements are being met–which usually entails a lot of paper shuffling and comparisons. Only 10% of time is spent on the meat of decision-making, asking predictive questions like, "What if we did this?"
Liston suspects that better information delivery using interrelated data on project design, combined with schedule and budget presented on touch-sensitive wall-sized displays, could end many of those hours spent digging though piles of plans and paper. If she’s correct, that piddling 10% of productive thinking time would soar to at least 50%. Liston has created just such an integrated data retrieval system and meeting space at Stanford, using software she developed to search across unrelated programs simultaneously. Liston’s i-Room is much in demand among researchers there.
 |
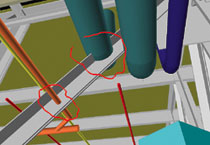 |
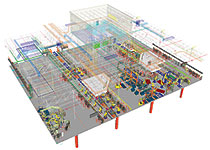
| Spotting Trouble. Ghafari leads review sessions to head off issues. (Images courtesy of Ghafari Associates, LLC) |
Coordinating Teams
Samir Emdanat, manager of advanced technologies, Ghafari Associates LLC, Dearborn, Mich., says the firm is developing a deep expertise coordinating teams with 3-D imagery. Ghafari is an architectural and engineering firm that performs a lot of complex auto plant work. It has two big plants under construction now. Ghafari coordinates the design disciplines and avoids conflicts by integrating everything into a single Bentley MicroStation 3-D project model, then huddling over it as often as three times a week with the entire project team, from sub to owner. "There is a 2-D plot that’s printed big so people can point at it, and a plot on the table, but the focus is on the screen, the 3-D model," Emdanat says. "We use it to coordinate the design disciplines and avoid interferences that would cost money in the field."
"When we started this it was something we were forcing into the process," Emdanat adds. "But as soon as the team realized it was a value-add it became a central tool of the meetings. Subcontractors were coming back and asking for more. All the issues that need to be addressed are addressed as they come up."
Emdanat says that the concept and tools are "more than presentations. It’s the way we deliver the project. What we do best is integrate all these representations into one model. We have a good handle on that. In the five years I have been working with 3-D it has been a struggle, but in the last year there has been a turnaround. People have moved from skepticism to actually using it. It’s going to be a big change."
Urban Building’s Case says the light when on for him a few years ago while shepherding a design through a building department. "We’d sit with the planners and they couldn’t grasp it," he says. "You’d spend hours in meetings and they wouldn’t always get it."
Case says he started looking for a better way to present information, and eventually turned to 3-D modeling. "I would put together a simple model with 3-D images, view it from several angles and show it to them, and in five minutes they would say ‘yes,’" he says.
Case’s imagery has gotten more sophisticated but remains quick and easy to produce. A current project, the development of an 18-phase, 25-year master plan for the Henry Mayo Newhall Memorial Hospital, Santa Clarita, Calif., combines modeling, aerial photography and ground-level digital photos to realistically portray proposed structures as if they were already there.
"It was all done by engineers in my office, very quickly and simply," Case says. "It’s a very sophisticated presentation of every building going into this neighborhood. Instant rendering–and there is no renderer involved. It’s a huge cost saving."
In a sense, imaging interprets and translates complicated drawings and eases the learning curve for laymen. "You don’t have to learn to look at a building," says Case. "You see it. I’m using 3-D graphics to visualize what people normally can’t see."


