States hiked their total spending on infrastructure, equipment and other capital-budget items by an estimated 2.4% in fiscal year 2014, to a total of $91.8 billion, a new National Association of State Budget Officers report says.
NASBO’s latest annual state expenditures report, released on Nov. 20, says that transportation accounted for the largest share of overall FY 14 capital spending, with an estimated $56.1 billion, up 3.7% from 2013.
Brian Sigritz, NASBO director of fiscal studies, says, “We saw a handful of states that increased gas taxes in 2013, which allowed a little bit more money for capital spending, [on] specifically the transportation side.” Examples include Maryland and Virginia.
States' environmental capital spending soared 25.3%, to an estimated $6 billion in FY 14. The report says the major factor behind that upturn is California’s estimated $1.4 billion in environmental expenditures, far above the state’s 2013 $131-million level.
Among other sectors, higher-education spending dipped 4.9% to $10.4 billion, and corrections expenditures rose 5.6%, to $3.7 billion.
States' capital spending on housing plummeted 20.7%, to $900 million.
The “all-other” category—which includes such items as public school upgrades, health-care infrastructure, zoo improvements and sports facilities—totaled $17.4 billion in fiscal 2014, up 5.5% from 2013.
Sigritz says one possible factor behind states’ overall capital spending boost is the January 2013 legislation that avoided the “fiscal cliff.” That measure led to a rise in 2013 state tax revenue.
He says, “Since the states recognized that it was only going to be a one-time increase, they tried to put it into one-time projects,” such as capital infrastructure. “We did see some of that take place,” he adds.
The NASBO study doesn’t state what portion of states' capital expenditures expenditures went for infrastructure construction.
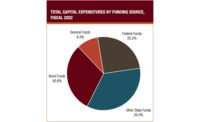
NASBO notes that 33.4% of the cost of states’ capital projects comes from dedicated fees and fund surpluses and 31% comes from bonds. Federal funds account for 29.4%.
Capital spending has tended to zig-zag. For example, states’ total capital expenditures climbed 2.4% in 2012, dipped 0.5% in 2013 and were estimated to have moved upward in 2014. NASBO says reasons for the up-and-down path include “long construction timetables and unforeseen or delayed project costs.”
The NASBO study covers all state expenditures, which totaled $1.8 trillion for fiscal 2014, a 5.7% increase over the 2013 level.
For 46 states, fiscal years end on June 30.


Post a comment to this article
Report Abusive Comment