Computer Models Used to Prepare for Climate Change
Boston Uses Tech to See What the Future Holds
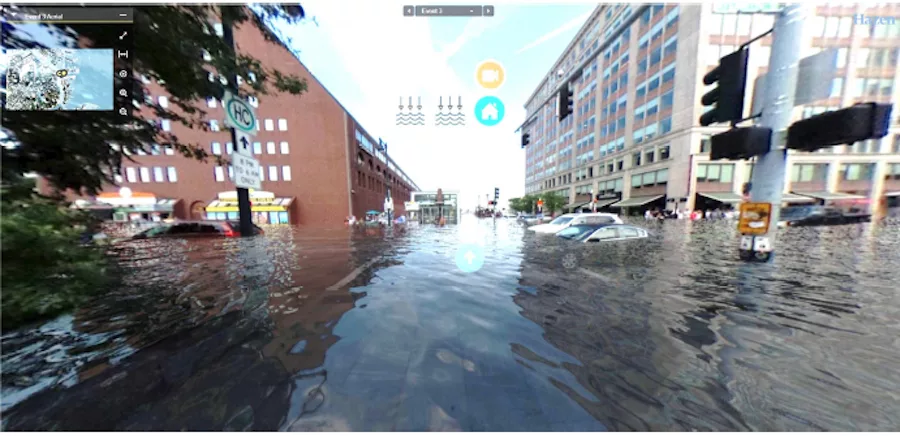
New stormwater computer models are combined with 360-degree photography and graphic renderings in key locations throughout Boston to illustrate potential flooding impacts from extreme storms.
Image courtesy of Hazen and Sawyer
As climate change becomes an undeniable reality, planners of infrastructure projects and agencies are taking steps to ensure coastal areas and other flood-prone regions can handle more frequent and more powerful storms. Stormwater modeling software, which provides dynamic rainfall-runoff simulations, is one tool that is assisting in this effort.
In Boston, the city’s water and sewer commission is working with civil engineering firm Hazen and Sawyer to develop an EPA Stormwater Management Model that will help predict how the city would be affected in the event of a major storm event.
After Hurricane Harvey hit Houston in 2017 Boston Mayor Marty Walsh (D) became concerned about similar massive flooding in Boston, says Charlie Jewell, director of planning and sustainability at the Boston Water and Sewer Commission.
Walsh wanted to know how many people would need to be evacuated from which parts of the city and for how long, Jewell said. He also wanted to know whether evacuation centers, emergency responders and hospitals would be in the affected areas.
The city already has a storm water management model, which helps predict runoff quantity and quality from drainage systems. Using that as a foundation, the city hired Hazen and Sawyer to assist with the $841,000 stormwater management project in July 2018. the commission began developing multiple storm scenarios from a 10-year to a 500-year event, Jewell says. Harvey was a 500-year flood event. The firm is running 24 models.
This is one of the first studies that examines potential flooding impacts using a dynamic two-dimensional model in such a large scale, says Charles Wilson, who is leading the modeling work at Hazen and Sawyer. “Most previous 2D modeling studies have been limited to a neighborhood-sized area, while the 2D extent in this study covers nearly half the city,” he says.
The study will provide initial information that could be used in future resiliency studies, emergency planning and storm preparedness.
Looking for quick answers on construction and engineering topics?
Try Ask ENR, our new smart AI search tool.
Ask ENR →
The commission also modeled 48-hour to 72-hour events and smaller thunderstorm events. “We ran the gamut of storms,” Jewell says. Then the team looked at storms that come from different directions and developed hydrographs to determine when the rain occurs—at the peak of the storm, the middle or the end of the storm.
The goal is to calculate the number of people affected by different category storms. “We will be doing a lot of work with the city to interpret these results,” to help with evacuations, transportation and other services.
The team is also trying to develop better visualization of what the results mean beyond what can be shown on a map. For instance, Hazen and Sawyer has developed an image of 4.3 feet of water on city streets near the Boston Aquarium to help people visualize the impact of a particular storm. “If you say four feet of water to somebody, it’s hard to detect on a heat map, but visualization can help,” Jewell says.
Meanwhile, the Massachusetts Department of Transportation is working with the Woods Hole Group, an environmental engineering consulting firm, to determine the ocean impact on coastal flooding from different events, including waves and storm surge.
“The Woods Hole Group is running the models now with all of our scenarios ready for the output files,” he says. “It’s very intense to run these models. After dividing the city up into five sections, each section takes 60 hours of computing time to run these scenarios.”
In other stormwater modeling work, Nitsch Engineering “prepared a preliminary hydrologic and hydraulic model for Boston’s Moakley Park that considered future rainfall as well as tidal conditions,” says Julie Eaton, lead resiliency engineer at Weston & Sampson, project management consultant for the $1.5 million one-year preliminary design phase which began in July.
“We are working with Nitsch to advance the model with alternatives to improve stormwater management on the site in upcoming tasks,” she says.
In Moakley Park’s Vision Plan, the team used existing lidar from the City of Boston and State of Massachusetts. Lidar data and ortho imagery--remotely sensed imagery geometrically corrected to adjust for lens distortion, camera tilt and topographical relief—provide info needed to create stormwater models.
Data collection is another tool that Weston and Sampson is using to assist in its understanding of climate impacts and projections. For example, in the Moakley Park project, the team installed monitoring wells with transducers on the site during subsurface explorations, Eaton says.
“We are in the process of collecting data over several months to better understand the relationship with groundwater and tides on the site,” she says. “Using the historical data and climate projections, we will evaluate how sea level rise may impact groundwater on the site from salt water intrusion, depth to groundwater, and other factors,” she says.


