Industry’s Largest R&D Effort Founded Interstate Construction
 |
As the U.S. Interstate Highway System was taking shape, state highway agencies charged with building it faced an immense challenge. If the system was to last longer than previous American highways, transportation officials found they needed solid facts and figures on performance and behavior of pavement structures to guide them in designing and building the largest public works project in U.S. history.
In 1951, the American Association of State Highway Officials began planning a road test, choosing a site in Ottawa, Ill., along a right-of-way that would become Interstate 80. There, environmental and subgrade conditions were representative of a good portion of the U.S.
|
AASHO designated the Highway Research Board (predecessor of the Transportation Research Board) to administer the AASHO Road Test. It was “an extremely tightly controlled experiment,” and the largest research and development effort in the construction industry up to that time, says Mike Ayers, director of highway pavement technology for the American Concrete Pavement Association. Funded by government and industry, it cost $27 million.
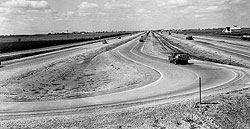
The test track consisted of six loops, each two lanes wide, totaling 14 lane-miles. Half of each loop was paved with portland cement concrete, and half with asphaltic concrete (ENR 6/19/58 p. 52). There were 836 test sections of pavement, representing 200 different combinations of surfacing, base and sub-base. Rigid pavements ranged from 2.5 in. to 12.5 in. in thickness. Some were laid directly on the compacted earth embankment, while others had 3-in., 6-in. and 9-in. granular sub-bases.
 |
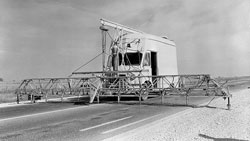
| Instruments. Transverse profilometer measured depth of rutting in flexible pavements. |
Performance Studied
Flexible pavements ranged from surface treatment only, to 6 in. of asphaltic concrete, including surface and binder courses. They were laid on crushed stone bases ranging in thickness from zero to 9 in., and on granular sub-bases from zero to 16-in. thick. Loops included 16 test bridge spans, including prestressed concrete, reinforced concrete deck and steel I-beam types.
Materials, mix designs and pavement density specifications were representative of those used in normal highway construction. Emphasis was placed on uniformity of construction, and a batch plant was built on site to insure consistency.
Loop 1 carried no traffic, serving as a control segment, subject only to weathering. Loop 2 carried only light trucks with 2,000-lb and 6,000-lb single-axle loads. Loops 3 through 6 carried increasingly heavier tractor-trailers, ranging from 12,000 lb to 30,000 lb on single axles and 24,000 to 48,000 lb on tandem axles. The truck fleet was driven and serviced by the Army’s Transportation Corps.
Test traffic began rolling in October 1958, for 18 hours per day. The remaining hours were used for taking measurements and performing maintenance. To achieve a goal of one million axle loads during the two-year test, the number of trucks was increased to 126, the schedule expanded from six to seven days, and traffic density increased from six vehicles to 10 per lane. It ended in November 1960.
The 225-person test staff used $1 million worth of test instruments to measure, record and analyze various physical characteristics, including longitudinal profile, roughness, cracking, patching, rut depths, and joint faulting.
Researchers analyzed the data and developed relationships between pavement performance and pavement design and load variables, with specific models for each pavement type. HRB issued an interim guide for design of rigid and flexible pavements in 1962, with performance equations to determine pavement thicknesses. It “clearly distinguished types of deterioration in the pavements as a function of the applied loads,” says Ayers.
(Photos courtesy of the Federal Highway Administration)
