 |
One of the most bullish forecasts for next years construction market comes from the U.S. Dept. of Commerce, which predicts that total construction in 2005 will increase 5.8% after this years extremely strong 9.2% increase. "Construction growth has been running ahead of that for the overall economy since 2001 and this year will break the trillion-dollar barrier for the first time," says Commerce economist Patrick MacAuley. Commerce believes that the housing market will maintain enough momentum from this years 14% increase to withstand the pressure of slightly higher interest rates and its forecast calls for the housing market to increase another 7.5% next year. The strong housing market will continue to pull up other markets as well. "There is a strong link between water and sewer construction and housing and there is a lot of catch-up work that has to be done," says MacAuley. He predicts a 5% increase in both water supply and the sewerage and waste disposal markets in 2005. He also sees solid growth in other public works markets and most nonresidential building markets. The fastest growing market in 2005 will be healthcare, which will follow this years 10% increase with another 8% gain next year, Commerce predicts. The only market it sees faltering is mass transportation, which is expected to dip 3%.
| U.S. Dept. of Commerce Construction Put-in-Place $ billions (current dollars) | |||||
| TYPE OF CONSTRUCTION | 2003 | 2004 | 2005 | PERCENT CHG. | |
| 03-04 | 04-05 | ||||
| TOTAL CONSTRUCTION | 915.7 | 1,000.2 | 1,058.0 | +9.2 | +5.8 |
| Residential | 482.9 | 550.5 | 592.0 | +14.0 | +7.5 |
| Lodging | 11.1 | 11.8 | 12.2 | +6.3 | +3.4 |
| Office | 41.5 | 44.8 | 47.5 | +8.0 | +6.0 |
| Commercial | 62.3 | 64.8 | 67.4 | +4.0 | +4.0 |
| Health Care | 29.9 | 32.9 | 35.5 | +10.0 | +7.9 |
| Educational | 74.2 | 74.9 | 77.2 | +0.9 | +3.1 |
| Religious | 8.5 | 8.2 | 8.3 | -3.5 | +1.2 |
| Public Safety | 9.0 | 8.7 | 9.0 | -3.3 | +3.5 |
| Amusement and Recreation | 20.0 | 20.0 | 20.4 | 0.0 | +2.0 |
| Transportation | 25.3 | 25.6 | 24.8 | +1.2 | -3.1 |
| Communication | 12.5 | 12.5 | 12.5 | 0.0 | 0.0 |
| Power | 33.2 | 33.9 | 34.9 | +2.1 | +3.0 |
| Highway and Street | 62.9 | 67.9 | 70.6 | +8.0 | +4.0 |
| Sewerage and Waste Disposal | 13.7 | 14.8 | 15.5 | +8.0 | +4.7 |
| Water Supply | 10.4 | 10.6 | 11.1 | +1.9 | +4.7 |
| Conservation and Development | 4.0 | 4.2 | 4.4 | +5.0 | +4.8 |
| Manufacturing | 14.3 | 14.2 | 14.6 | -0.7 | +2.8 |
| Source: U.S. Dept. of Commerce Figures for 2004 are estimated. Federal industrial includes weapons R&D and production, atomic waste isolation and reprocessing and environmental cleanup; conservation and development, includes electric power dams. | |||||
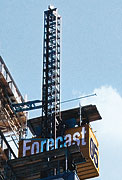
(Photo top by Monica N. Macezinskas, photo manipulation by Nancy Soulliard for ENR)
|

Post a comment to this article
Report Abusive Comment