3-D View
Each design and applicable construction schedule was modeled against the master integrated schedule to illustrate the options. It would have been hard to visualize the options from a single flat plan, Harvey says. “It’s much easier to work from 3D,” he adds. “ It helps people understand the complexity and come up with workarounds to do it more efficiently.”
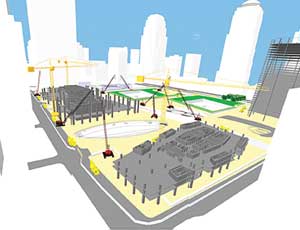
A 4D perspective also facilitates identifying interdependencies and clashes between projects. Scenario or “what-if” analyses assess how changing construction sequences affect the overall schedule and identify constraints and conflicts.
“If we really want to drill down, we use Pertmaster to look at the families of different probable outcomes related to the risks of these clashes,” Harvey says. “We are then able to depict clearly to stakeholders where the clashes are between their various projects.”
Scenarios analysis was used to illustrate how delays or design changes for different areas of the underground MEP systems impacted the overall delivery of the sitewide systems, such as fire alarm systems and water delivery systems for sprinklers, Chattaway says.
At the height of construction, close to 30 cranes will be operating at the WTC site. Crane movements were modeled in 4D to analyze adjacent project schedules and logistical plans to see if they clash with other equipment at the site, Chattaway says. Potential clashes also were identified if cranes did not complete operations on time.
When projects get delayed, 4D modeling helps to develop workarounds, as was the case with the schedule for the vehicle security center and the deconstruction of the Deutsch Bank building. “You try to prioritize and meet the best overall schedule,” Harvey says.
Simultaneous 4D views of all projects downtown permits detailed logistical analyses. For instance, one of the analyses showed a large number of sites scheduling concrete pours at the same time, Chattaway says. “Some of the projects decided to go for weekend concrete pours to try to avoid the volume of trucking during the week,” he adds.
By aggregating data across all projects, the team put together histograms of the demand for labor and materials along with the number of trucks required to deliver the materials at different points in time. These analyses then compare the demand versus the supply, identifying potential shortfalls.
Analyses show that between 2010 and 2011, 600-700 trucks a day will enter downtown, Harvey says. LMCCC and the New York City Department of Transportation are using Paramicsto model street conditions and assess the impact of building and street construction on vehicular movement in the area.
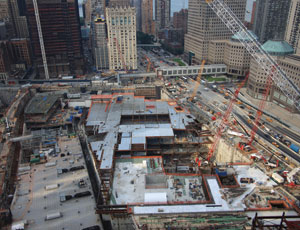
Harvey says he is finding that 4D is a powerful tool for communicating progress on the site. Visual images of where the project should be can be compared to images showing actual progress. “Then you can analyze where the schedule has slipped and go back into and modify the schedule to come up with workarounds,” he says.


