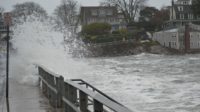
Almost a quarter, or 2 million miles, of the nation’s roads are currently at risk of becoming inoperable from flood damage, according to a new assessment of infrastructure across the country from First Street Foundation.
Other types of infrastructure face similar risks. At 25%, critical infrastructure has the highest amount of risk nationwide, with residential infrastructure cited as having the lowest, at 17%.
The risk is not evenly distributed geographically. The top four most at-risk U.S. counties or parishes are in Louisiana, all facing a risk of inoperable infrastructure above 90% because of flooding. The top two most at-risk cities, Metairie and New Orleans, are also in Louisiana. They are followed by Cape Coral, Fla., and Stockton, Calif.
The study, “The 3rd National Risk Assessment: Infrastructure on the Brink,” used publicly available data to map and analyze risk across five categories, including critical infrastructure like airports, hospitals, ports, power plants, superfund sites, wastewater treatment facilities and fire and police stations.
While critical infrastructure is presumably built to higher design standards than residential infrastructure, it still faces the greater risk. “We tend to find it falls in downtown areas and along rivers and along the coast. It just tends to be in places that are more flood prone in general,” says Jeremy Porter, head of research and development at First Street, and one of the report’s authors.
“We didn’t know that to begin with. It wasn’t until we mapped it,” adds Porter, showing that “city centers tend to fall along those nature river channels or along the coast.”
First Street’s flood model captures flood risk from rainfall in addition to river and coastal flooding, so a number of locations with recent flooding, such as Tennessee, are not in the Federal Emergency Management Agency [FEMA] special flood hazard areas. That's because precipitation is not included in the agency's determination, says Matthew Eby, First Street Foundation founder and executive director.
That precipitation piece is why counties in states like West Virginia are appearing in the report, says Porter. Two West Virginia counties, in fact, are in the list's Top 20. For context, no South Carolina counties are included.
The report looks at current risk as well as that projected in 30 years, with climate change altering the picture of future risk. “Places like Virginia show up a lot when you start thinking about which places are going to change the most over the next 30 years,” says Porter.
“That’s primarily because warming sea surface temperatures and warming atmospheric temperature are driving stronger, although not necessarily more frequent, tropical cyclones that reach further north. They move slower and dump more precipitation as they [travel] across the land,” he says.
That description may bring Hurricane Ida to mind, and Porter says the model captured areas in Queens, N.Y., where flooding was caused by record precipitation from Ida-induced rainfall.
The other categories examined by the report are roads, residential properties, commercial properties and social infrastructure, which includes government buildings, schools, historic buildings, houses of worship and museums.
Risk is defined as the point at which the infrastructure’s operability is affected, according to design standards of the American Society of Civil Engineers, FEMA and others. Accordingly, a power plant built to standards that account for 2 ft of flooding would not be counted as at risk if it was projected to receive 18 in. of flooding, explains Porter.
The report uses current design standards, so a structure built to an earlier, less robust standard may be at greater risk. Inversely, because the report uses public records and assumes infrastructure is built to the current standard, structures built to a greater resilience than the standard may be at less risk than shown.
Complementing the report is a searchable visual database that includes a map showing an area's specific infrastructure with level of risk for each, from moderate to severe, based on the type of flooding that is modeled to occur. The range covers a 1-in-2-year event up to a 1-in-500-year event.
The database may be particularly helpful to communities without funding or staff able to create a resilience report, says Eby, adding that the foundation hopes to provide them with a baseline understanding of risk. The knowledge, he says, can help those communities figure out where to start planning and gain added resources, including working with outside firms when needed.
Porter says: “Essentially, when we were building this out, we said, if we were going to write a report for a small community, what would it look like?”


Post a comment to this article
Report Abusive Comment