Every year, Arne Ruud has between $6 million and $10 million to spend on new construction machinery. The corporate equipment manager for Broomfield, Colo.-based Guy F. Atkinson Construction LLC says, next year, he probably will spend most of his budget, which is an unusual move in this time of thrift.
When the recession hit in 2008, contractors scaled back dramatically on fleet spending. “In some of our areas the markets have just disintegrated,” Ruud explains. “That doesn’t give you a lot of confidence to go out and buy new iron.”
Many have been fixing up their older gear, and manufacturers are reporting healthy parts sales. But the Band-Aids can last only so long. For the rental fleets, “the average is four years old, which means that the oldest is eight years old. That’s pretty old,” says Frank Manfredi, a heavy-equipment analyst in Mundelein, Ill.
U.S. construction machinery, which Manfredi watches across several categories (see table below), is expected to climb 11.6% this year, to 83,650 units, and rise another 9.6% next year after suffering a nearly 50% drop-off last year. Still, the forecast would fall in line with 1993 levels. The recovery has a long way to go yet.
Dealers and rental suppliers have been adding inventory while offering discounts to help move new iron. A popular financing tool is a rent- or lease-purchase agreement in which a contractor borrows a machine while building equity on its future purchase. Though Atkinson usually buys more than rents, “We’ve been using a lot of lease-purchases with the full intent of buying [the equipment],” says Ruud. “Part of that is that we have been seeing some pretty good deals right now.”
A big question is whether these rentals will be converted to sales soon, as most of the manufacturers’ business this year went to building up dealer inventories. For example, Caterpillar Inc. took in a third-quarter profit of $792 million, up 96% over the same period last year, on sales of $11.1 billion. “I see a big disconnect between what the manufacturers are reporting and the economic indicators,” Manfredi says. At some point, he and economists say, a rise in construction must take over for the recovery to continue.
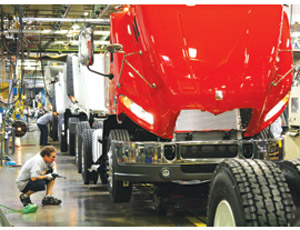
Housing construction—which helps drive equipment sales, including trucks—is still waiting for foreclosures to clear up. “We’re hoping that the construction market comes back, but obviously we need to sort out our problems with housing,” says Denny Slagle, president and CEO of Volvo Group’s North American Trucks.
On the flip side, truck sales are bouncing back, suggesting commercial freight is going up. By about the second quarter of 2010, “we started seeing revenues climbing and profitability going up” for truckers, notes Kenny Vieth, president and senior analyst at ACT Research, Columbus, Ind. Vieth predicts heavy-truck sales to climb this year to 152,000 units, or 28%, and next year to rise to 234,000 units, or 54%. However, the share of work trucks is lower than usual. Heavy trucks classified as “non-sleepers” usually make up 30% of the Class 8 market in the U.S., says Vieth; year to date, it is only 26%.
Clean air is another recovery hurdle. Fleet managers are expecting equipment prices to rise by as much as 12% starting next year as off-road manufacturers begin phasing in federally regulated, Tier 4 “interim” clean-diesel engines. Prices will likely rise again in a just few years as Tier 4 “final” engines roll out. The interim may encourage buyers working in high-pollution zones, where contracts demand the cleanest machines available, to put off big purchases. Says Ruud, “If you buy a $2-million crane, you’d hate to think you are going to be in the business of repowering it in two years.”
| PRODUCT | 2007 | 2008 | 2009 | 2010(F) | 2011(F) | ’10 vs. ’11 (%) |
|---|---|---|---|---|---|---|
| Asphalt Pavers | 1,636 | 1,409 | 1,100 | 1,150 | 1,200 | 4.3% |
| Compactors | 9,600 | 6,550 | 2,800 | 2,950 | 3,000 | 1.7% |
| Cranes | 1,750 | 2,100 | 1,500 | 1,100 | 1,250 | 13.6% |
| Crawler Tractors | 12,800 | 9,750 | 5,000 | 5,500 | 6,000 | 9.1% |
| Hydraulic Excavators | 39,000 | 25,750 | 11,000 | 12,500 | 13,000 | 4.0% |
| Loader-Backhoes | 18,000 | 15,500 | 6,600 | 7,000 | 8,000 | 14.3% |
| Motor Graders | 3,500 | 2,700 | 1,700 | 1,800 | 2,100 | 16.7% |
| Haulers (Rigid) | 800 | 900 | 550 | 650 | 700 | 7.7% |
| Haulers (Articulated) | 3,000 | 1,900 | 800 | 800 | 900 | 12.5% |
| Rough-Terrain Forklifts | 16,250 | 11,050 | 5,000 | 4,700 | 5,000 | 6.4% |
| Rubber-Tracked Loaders | 19,000 | 15,500 | 9,000 | 11,000 | 12,000 | 9.1% |
| Skid-Steer Loaders | 44,500 | 38,000 | 23,000 | 27,000 | 30,000 | 11.1% |
| Trucks (Class 8) | 212,400 | 205,600 | 118,400 | 152,000 | 234,000 | 53.9% |
| Wheel Loaders | 16,000 | 13,430 | 6,900 | 7,500 | 8,500 | 13.3% |
| TOTAL (not including trucks) | 185,836 | 144,539 | 74,950 | 83,650 | 91,650 | 9.6% |
| Source: Manfredi & Associates, ACT Research. U.S. retail Sales for construction equip. North America production for Class 8 trucks. | ||||||


Post a comment to this article
Report Abusive Comment