The American Council of Engineering Companies has released what it says is a “landmark” study of how qualifications-based selection (QBS) for design, rather than low-bid, can ensure positive project outcomes, particularly on large and technically complex jobs. The detailed, university-conducted analysis of 41 projects in 23 states, all but 5% of which were public-sector jobs, says the approach resulted in only 3% construction cost growth and virtually universal owner satisfaction in buying engineering services. But researchers noted limits in the survey as well as cost-linked challenges to QBS in some states. The American Public Works Association collaborated in the $90,000 survey.
The survey, released on Jan. 11, was co-managed by Paul S. Chinowsky, associate professor in the Dept. of Civil, Environmental and Architectural Engineering at the University of Colorado, Boulder, and Gordon A. Kingsley, associate professor in Atlanta-based Georgia Institute of Technology’s School of Public Policy. They drew from a database of nearly 200 public and private projects across multiple markets, with transportation respondents the largest group at 44%. Projects ranged from $25,000 to $900,000 in construction cost.
Researchers compared such factors as total project cost, projected life-cycle cost, risk levels, owner relationships and satisfaction, and quality-of-life impacts.
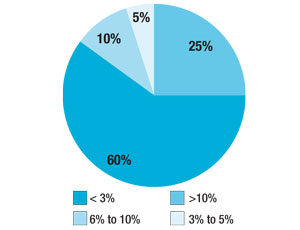
“We found a quantitative and tangible result that, while QBS contracts for design may cost a little more up-front (about 2%), the projects resulted in lower costs and reduced schedules,” says Chinowsky (see charts). “So when the project appears to be a challenge for the owner and when the contracting official has concerns about getting it done, QBS becomes increasingly important. Companies that do a significant part of their work through traditional QBS methods have a strong relationship with owners.”
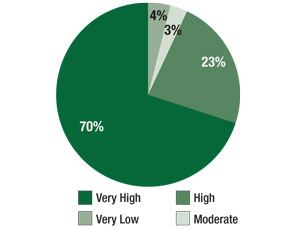
He notes that more than half of respondents have done 10 or more projects with the same owner. “There is a strong degree of embeddedness by the firms with the owners,” he says. Owners rated project success rates “high” or “very high” in 93% of cases, says the survey.
Results show using QBS for design lowered projects’ change-order rate from 10% to 3% on average, and 60% of respondents reported 3% schedule growth compared to the industry average of 8.7%. “Since the design component of a project is just a small fraction of the overall project cost, low bid at this early critical stage would undercut obtaining a successful design—a design which also would achieve lower life-cycle costs,” says ACEC President David A. Raymond.
But researchers pointed out that results did not reflect the inclusion in the database of enough non-QBS projects for comparison and that it may be too small to represent the universe of jobs eligible to use the approach. Chinowsky adds that QBS procurements better focused on sustainability and other “societal” project impacts and better protected the “intellectual property” of design innovations.
While the Brooks Act has required QBS on federally funded projects since 1972 and most states and many municipalities have followed suit, the approach is facing new challenges, says the study. Some procurement officials are questioning whether QBS is necessary for more standardized designs or making cost a more important selection factor. Researchers say some states are moving to weaken QBS rules as they enact design-build and alternative delivery methods.
| 1 = Low 5 = High | 1 | 2 | 3 | 4 | 5 |
|---|---|---|---|---|---|
| Construction Cost and Schedule | 0% | 20% | 53% | 23% | 4% |
| Social Risk (Community acceptance of project) | 30% | 30% | 27% | 7% | 6% |
| Politcal (Political officials will require design changes) | 23% | 30% | 23% | 18% | 6% |
| Owner Relationship | 23% | 40% | 30% | 7% | 0% |
| A SUMMARY OF RESPONSES TO PROJECT AND DESIGN RISK IN THE SAMPLE SET. | |||||


Post a comment to this article
Report Abusive Comment